

It's a classic pattern in the business world: a small or medium-sized company decides to take the leap into the culture data-driven and optimize your architecture of Power BI. However, a few months after acquiring the licenses and quickly building the first reports, reality sets in.
However, after a few months reality sets in and the three structural problems of Business Intelligence: Reports that take minutes to load, inconsistent data between departments, and multiple versions of the same KPI (where sales handles one turnover figure and finance handles a different one).
When this happens, the natural tendency is to blame the tool. But the problem is almost never the platform. On the contrary, the root cause is in a poor underlying configuration. In Bidatia We approach analytical projects from a data engineering perspective. Therefore, in this technical guide, we break down the Power BI architecture Recommended best practices for development and the ideal deployment plan for growing companies.
Recommended Power BI Architecture: The Decoupled Approach
The fundamental error in most organizations is connecting Power BI Desktop directly to transactional databases (ERP, CRM) and performing all processing, cleaning, and modeling within a single .pbix file. This monolithic approach is unsustainable.
A modern and professional architecture demands decoupling responsibilities into four clearly differentiated layers:
- Data Source Layer Relational databases (SQL Server, PostgreSQL) or cloud repositories where the company's operational data resides.
- Transformation Layer (ETL/ELT): Data processing and cleaning should not overload the report. Bidatia we outsourced this logic using Power BI Dataflows (data flows), Microsoft Fabric, or dbt, ensuring that the data arrives clean and structured.
- Semantic Model Cover (The Critical Point): It is the heart of the system. A single master file centralizes business rules, relational structure, and complex measures in DAX, serving as the «single source of truth» for the entire company.
- Visualization Cover Multiple independent Power BI reports connected liveLive Connection) to the centralized semantic model.
Best technical practices for a high-performance environment
To build a robust and agile system, our BI engineers apply very strict design guidelines:
- Star schema modeling: It is strictly forbidden to work with unique and flat tables (massive Excel style). We structure the model by separating Fact Tables numeric metrics and transactions, such as Sales o Shipmentsof the Dimension Tables contextual attributes, such as Customers o Products), connected by simple one-to-many (1:*) relationships.
- VertiPaq Engine Optimization The internal engine stores data in memory columnarly. As a result, an excess of unnecessary columns severely penalizes performance. For this reason, we removed free-text fields with high cardinality from the datasets and prioritized optimized DAX variables.
- Semantic Model Reusability: Instead of creating a dataset For each report, we publish a single model certified by business domain (Finance, Operations, Sales). From there, company analysts can design dozens of dashboards without duplicating logic.
Common Error Matrix and Engineering Solutions
After auditing dozens of analytical deployments, here are the main technical pitfalls in enterprise environments:
| Habitual Error | Operational Consequence | Engineering Solution |
| Build everything locally | Duplicate logic and heavy files that are impossible to maintain. | Outsource cleaning in the ETL layer and calculation in the service cloud. |
| Multiply the datasets | Inconsistent KPIs (e.g., three ways to calculate «Margin»). | Implement a single, centralized, and certified semantic model. |
| Do not define a dictionary | Different views of reality on management committees. | Create a technical glossary where the exact formula of each KPI is documented. |
| Ignore cardinality | Slow reports causing user rejection. | Optimization from preliminary design by eliminating free-text columns. |
| Lack of government in the service | Absolute chaos of duplicate reports and uncontrolled access. | Configure Workspaces structured by departments with clear roles. |
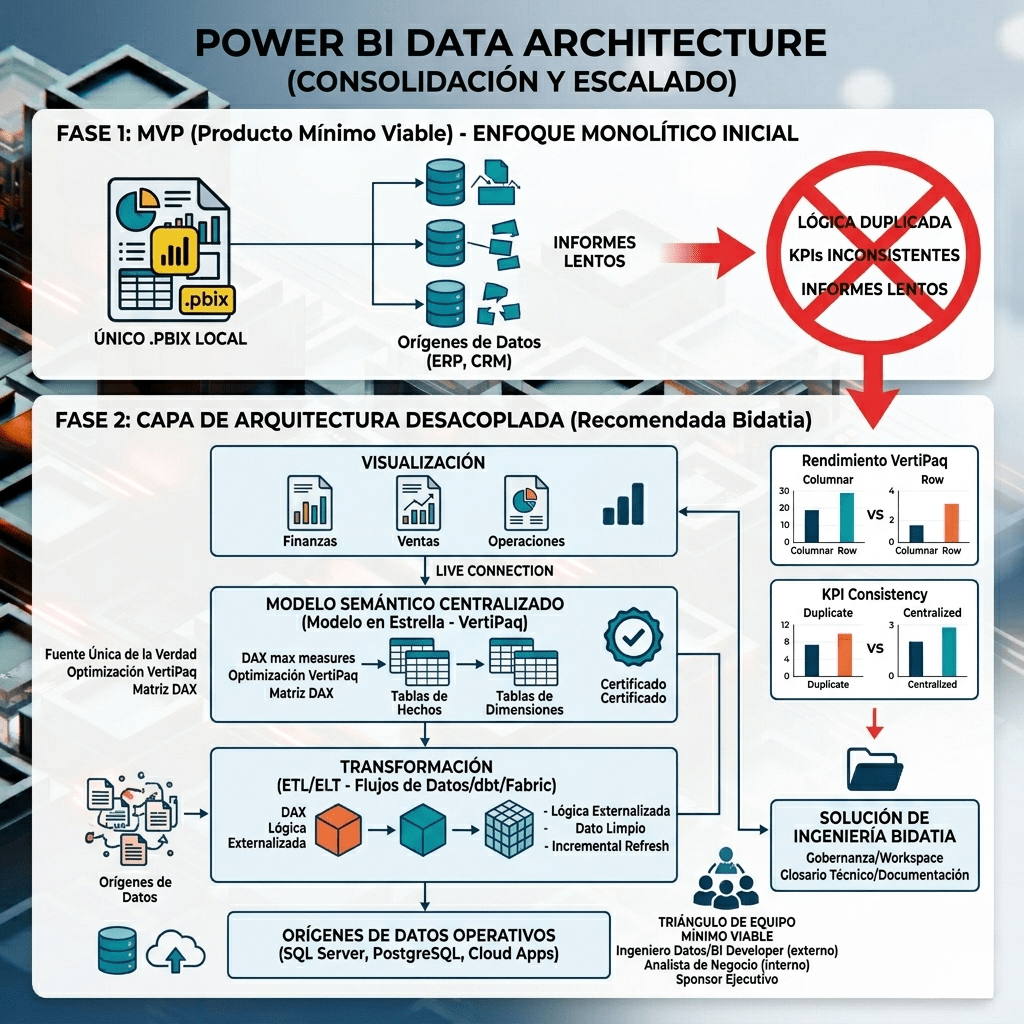
Phased gradual implementation proposal
A growing organization cannot afford Business Intelligence projects that take a year to implement. That's why we apply an agile deployment methodology:
- Phase 1: MVP (Minimum Viable Product): In a few weeks, we tackle a single critical use case. We build a bounded semantic model and a functional dashboard for a department (e.g., Sales). This quickly demonstrates the value of the project.
- Phase 2: Consolidation: With the MVP validated, the technical foundations are laid. Advanced DAX formulas are refined, and tasks are optimized. Scheduled and incremental refresh To avoid saturating the origin servers.
- Phase 3: Scaling and Governance Dashboards from other departments connected to the architecture are added. Policies are implemented Row Level Security (RLS) so that each delegate or sales manager sees only the data corresponding to their role.
The Minimum Viable Team For this cultural change to succeed, you don't need a giant data department. A perfect triangle is enough: a Data Engineer / BI Developer external (provided by Bidatia) for the technical architecture, a Business Analyst internal person who knows the company's processes, and a Sponsor Executive (Manager or Director) to lead the project.
Conclusion: Scalability with a Good Power BI Architecture
The deployment of this tool is a strategic investment with a high return. However, This is only possible if it is executed with engineering rigor.
At Bidatia We are specialists in correcting, optimizing, and implementing a Power BI architecture high-performance. We help your team transform your databases into a reliable decision engine.